A predictive model using arts venue programming data
Harrison Chambers
This is a portfolio version of a project completed for a real restaurant and arts venue. The venue, restaurant, and operator names below are pseudonyms (“Riverside Bar & Grill”), and revenue and covers figures have been converted to unitless indices. Model accuracy statistics (R², error reduction vs. business forecast) are the real, unaltered results.
Overview
Riverside Bar & Grill’s demand is driven substantially by the arts centre’s programming, mostly theatre shows and concerts in the building. This project tested whether that relationship could be modeled directly: using ticket sales data, reservations, and simple calendar effects (all of which are already being captured and are readily available), a regression model was built to predict daily covers and net revenue between one and twenty-eight days in advance.
The result: the model explains up to 81% of the day-to-day variation in net revenue and 72% in covers at one day out, still explaining 69% and 63% respectively a full four weeks out. Tested directly against the business’s own daily revenue forecasts over the same period, the model’s predictions were 29–41% more accurate (lower error), depending on time horizon.
This is a proof of concept, not a finished operational tool. It was built independently, on roughly a year of data, without several refinements described in the Future Considerations section below. But it demonstrates that a lightweight, low-maintenance forecasting model is not just feasible but already outperforms the current process, using data neither team needs to collect anything new to produce.
Background & Problem
Riverside Bar & Grill is a restaurant operated by a hospitality partner inside a major arts centre in central London. Due to the pre-theatre nature of the restaurant, a sold-out show in the building can double covers on an otherwise quiet Tuesday, and a dark night can leave the restaurant nearly empty on an otherwise strong Saturday. Staffing, ordering, and stock decisions currently rely on the restaurant manager’s own judgment and experience, informed by whatever programming information is at hand.
The question behind this project: how much of that demand is actually explainable, systematically, from data both organizations already have? If ticket sales for that night’s show, reservations already on the books, and the day of the week can predict covers and revenue with reasonable accuracy, that’s a more consistent and scalable input to planning than any one person’s read on the calendar.
Motivation: What This Could Enable
The vision behind this project is an automated email to the restaurant manager, sent on a regular cadence, with predicted covers and revenue (a plausible range, not just a single number) for roughly the next two to four weeks, plus how those numbers have moved since the last update. A simple table and a chart, arriving without anyone having to ask for it:
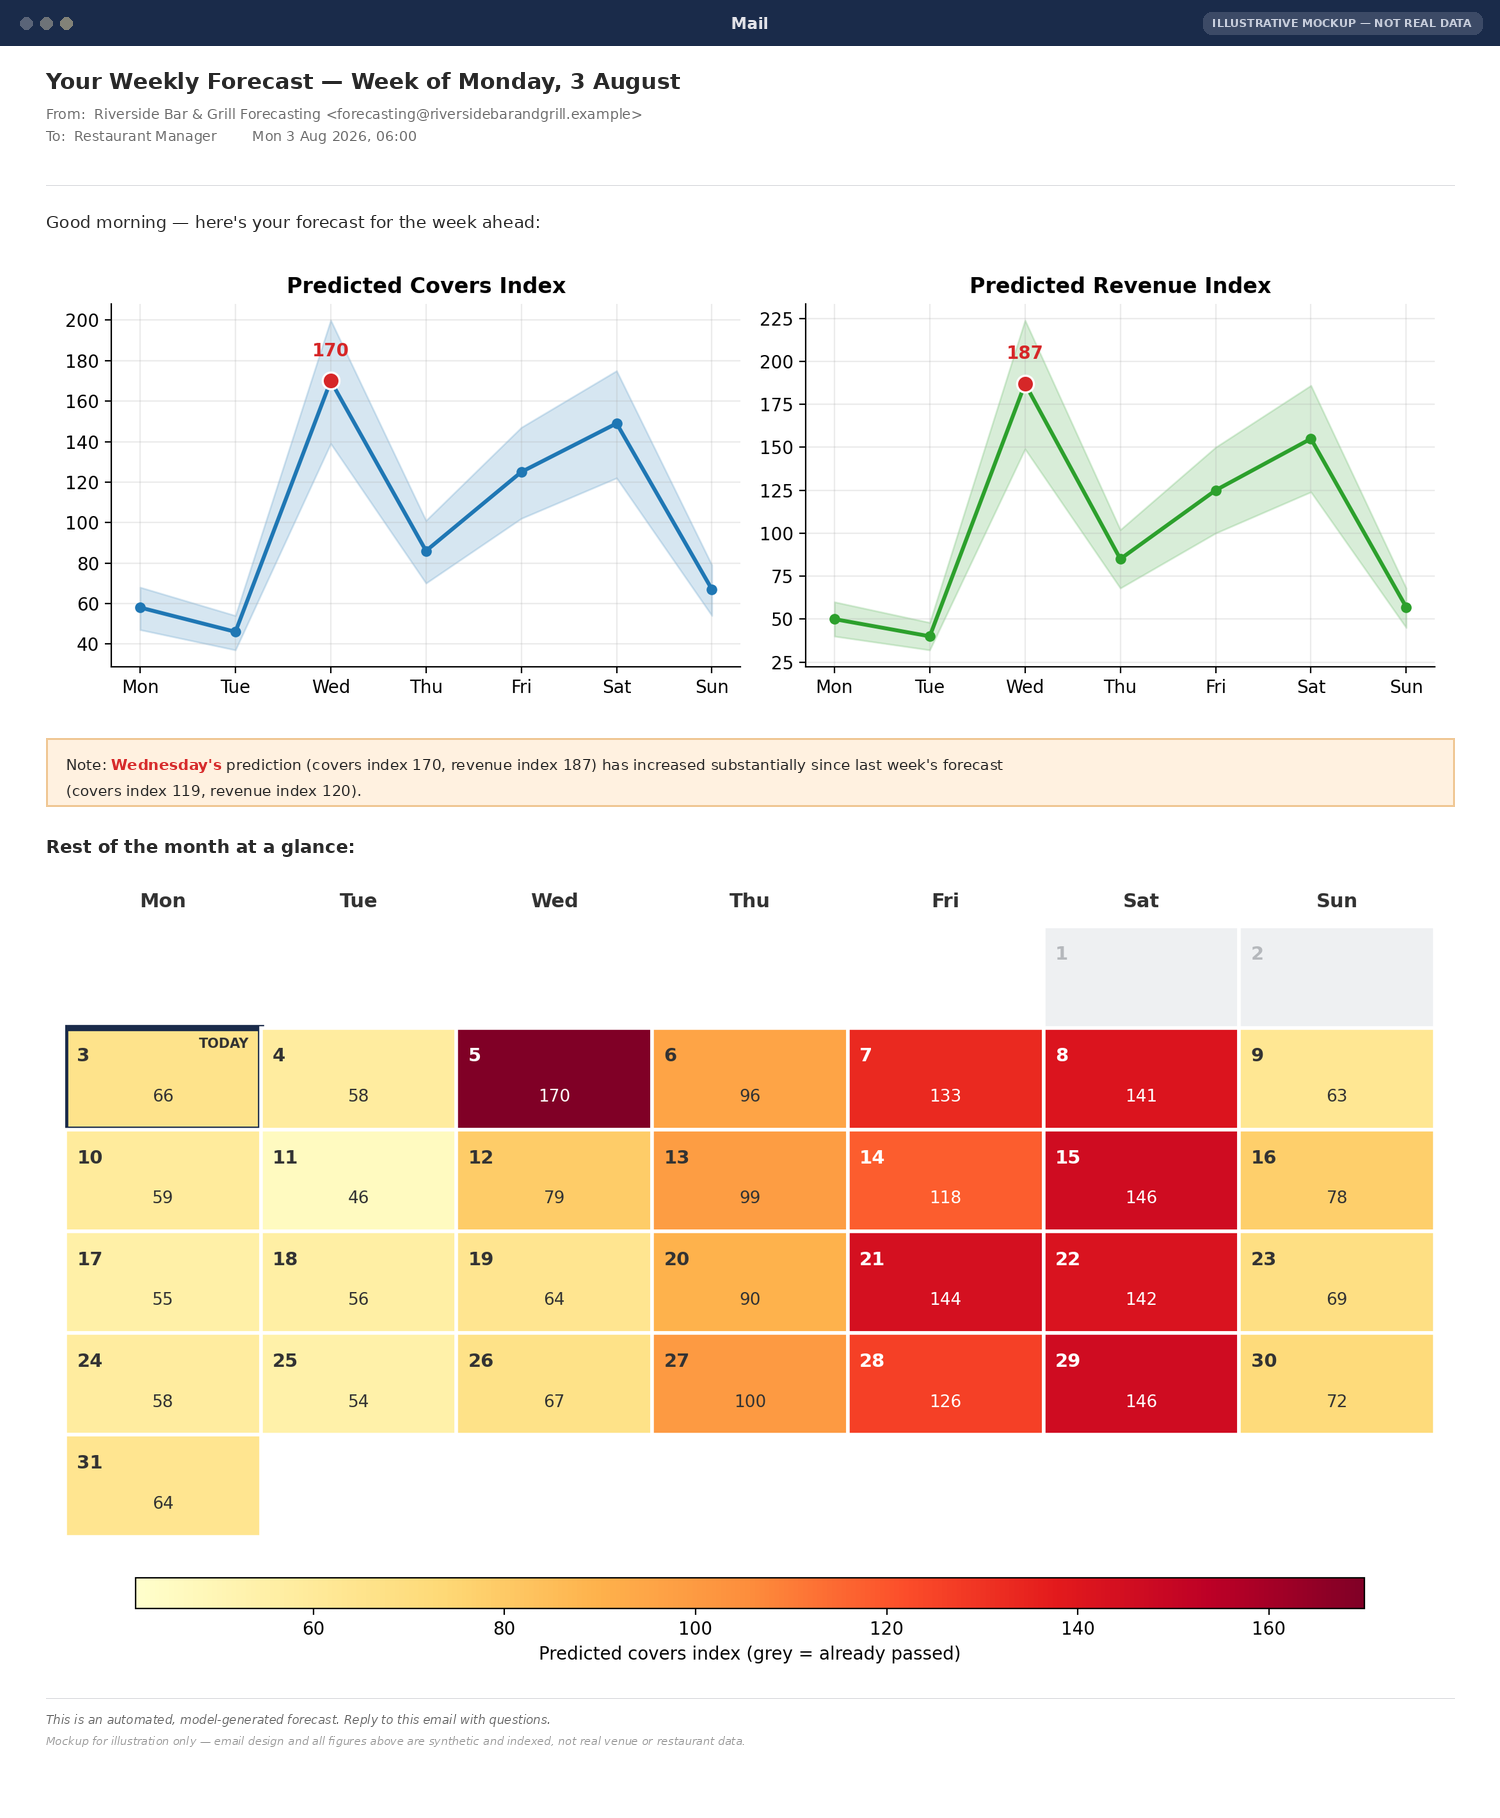
The goal isn’t to replace the manager’s judgment, but rather to give them a great starting point which is grounded in data, as well as to save them time compared to browsing the venue’s public website to get a sense of how ticket sales are going. Done well, this has the potential to reduce under- and over-staffing without adding anything to anyone’s workload.
This project doesn’t build that email. It answers the more fundamental question that has to be true first: is the underlying prediction actually good enough to be worth building it?
Approach
Data
Three sources were joined on date, covering roughly 15 months of daily history:
- Venue ticket sales (the venue’s ticketing system) — restricted to on-site theatre shows and concerts, excluding other event types which don’t typically feed pre-theatre dining the same way.
- Restaurant reservations — booked covers, with booking date and cancellation timing.
- Restaurant daily sales — the actual covers and net revenue figures being predicted.
Feature Engineering: Predicting Only From What Would Actually Be Known
The central design constraint is that a forecast made 7 days out can only use information that existed 7 days before the target date. Both ticket sales and reservations have “time of [ticket sale/reservation]” fields that make it possible to reconstruct, for any past date, exactly what was on the books at any earlier cutoff, not just the eventual final totals. Every feature below is generated this way, separately for each of 28 horizons (T-1 through T-28):
- Live tickets sold as of that cutoff, and their average price
- Reservation covers on the books as of that cutoff, net of cancellations known by that point
- Day of week (6 dummy variables)
Four additional features were tested and dropped: two ticket-based features, neither of which showed a meaningful relationship with covers or revenue (average ticket purchase lead time and the share of tickets bought in large-group orders), and bank/school holiday flags (school holidays showed no measurable effect; bank holidays showed a strong effect but was estimated from only a handful of actual holidays in the data).
Targets and Models
Covers (headcount) and net revenue were modeled independently. Average spend per cover varies enormously (a modest drink at the bar vs. a full pre-theatre dinner with all the bells and whistles), so there was no reason to assume one target would cleanly predict the other.
The following models were constructed for each of the 28 horizons and both targets (56 models total): a day-of-week average as a naive baseline, an OLS linear regression as the primary interpretable model (used for the headline numbers below), and a Lasso-regularized regression with time-series cross-validation as a robustness check. The two models tracked each other closely throughout, which is a useful signal that the OLS results aren’t an artifact of overfitting a model with no regularization.
Validation
Training and test data were split at a fixed date rather than a rolling or random split. This was chosen because of show runs: a major summer musical started at the beginning of one month, a new play started at the end of a later month, and there were a few weeks in between without any major theatre show on. Since theatre runs last several weeks or even months sometimes, nearby dates aren’t independent of each other in the way a textbook regression assumes. Separating entire shows between the training and testing datasets ensures the model’s apparent accuracy isn’t inflated and represents more closely how it would be used going forward.
Results
Model Accuracy by Horizon
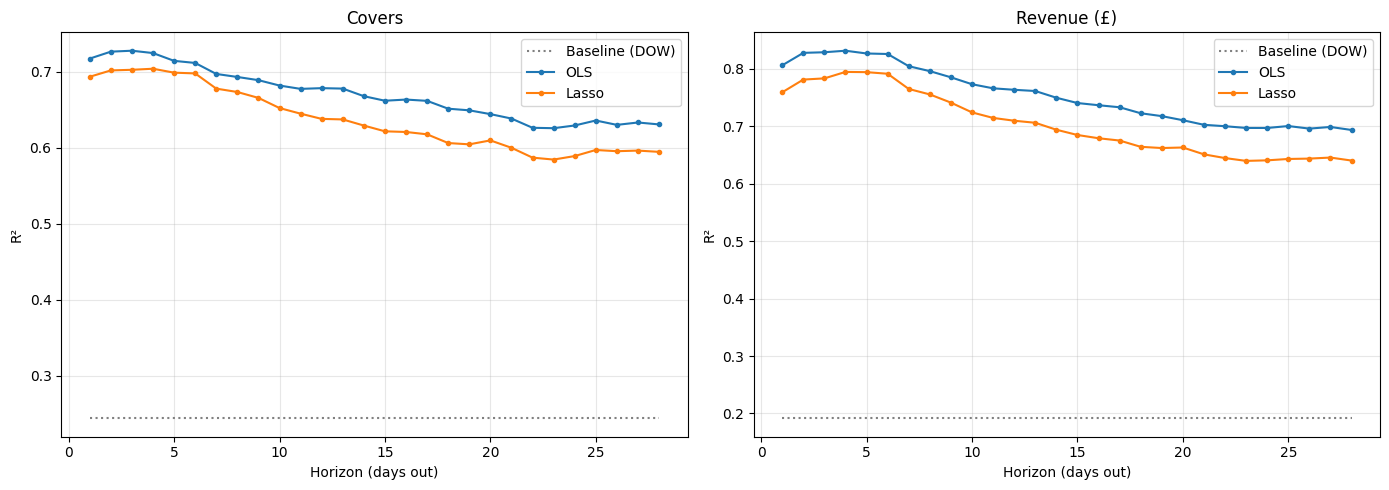
R² by forecast horizon (T-1 through T-28), covers and net revenue, OLS and Lasso vs. a day-of-week baseline.
| Horizon | Covers R² | Revenue R² |
|---|---|---|
| T-1 | 0.72 | 0.81 |
| T-7 | 0.70 | 0.80 |
| T-14 | 0.67 | 0.75 |
| T-28 | 0.63 | 0.69 |
| Day-of-week baseline | 0.24 | 0.19 |
Both targets beat a naive day-of-week baseline comfortably and consistently across all time horizons tested. As expected, accuracy declines gradually as the forecast window lengthens, since less is known about ticket sales and bookings the further out the prediction is made. Net revenue is consistently more predictable than covers at every horizon.
Accuracy holds up further out than the T-28 cutoff used for the final model set. An earlier checkpoint test at T-56 (eight weeks out) still reached R² of 0.60 for covers and 0.67 for revenue, comfortably ahead of baseline. T-28 was chosen as the cutoff for this project for a month-ahead planning use case, but a longer forecast window is likely viable.
Which Features Matter the Most
At T-1, the most important feature was the number of reserved covers, followed by the two ticket sales features (total tickets sold and average ticket price). By T-14, the average ticket price was the most important feature. Days of the week have a definite impact, but less than the ticketing and reservation features.
Compared Against the Business’s Own Forecast
The most direct test of whether this model adds value: how does it compare against the venue’s existing daily net revenue forecast, on the same dates? Restricting to the roughly 96-day period the model never saw during training, for a fair comparison (currency and error figures expressed as an index):
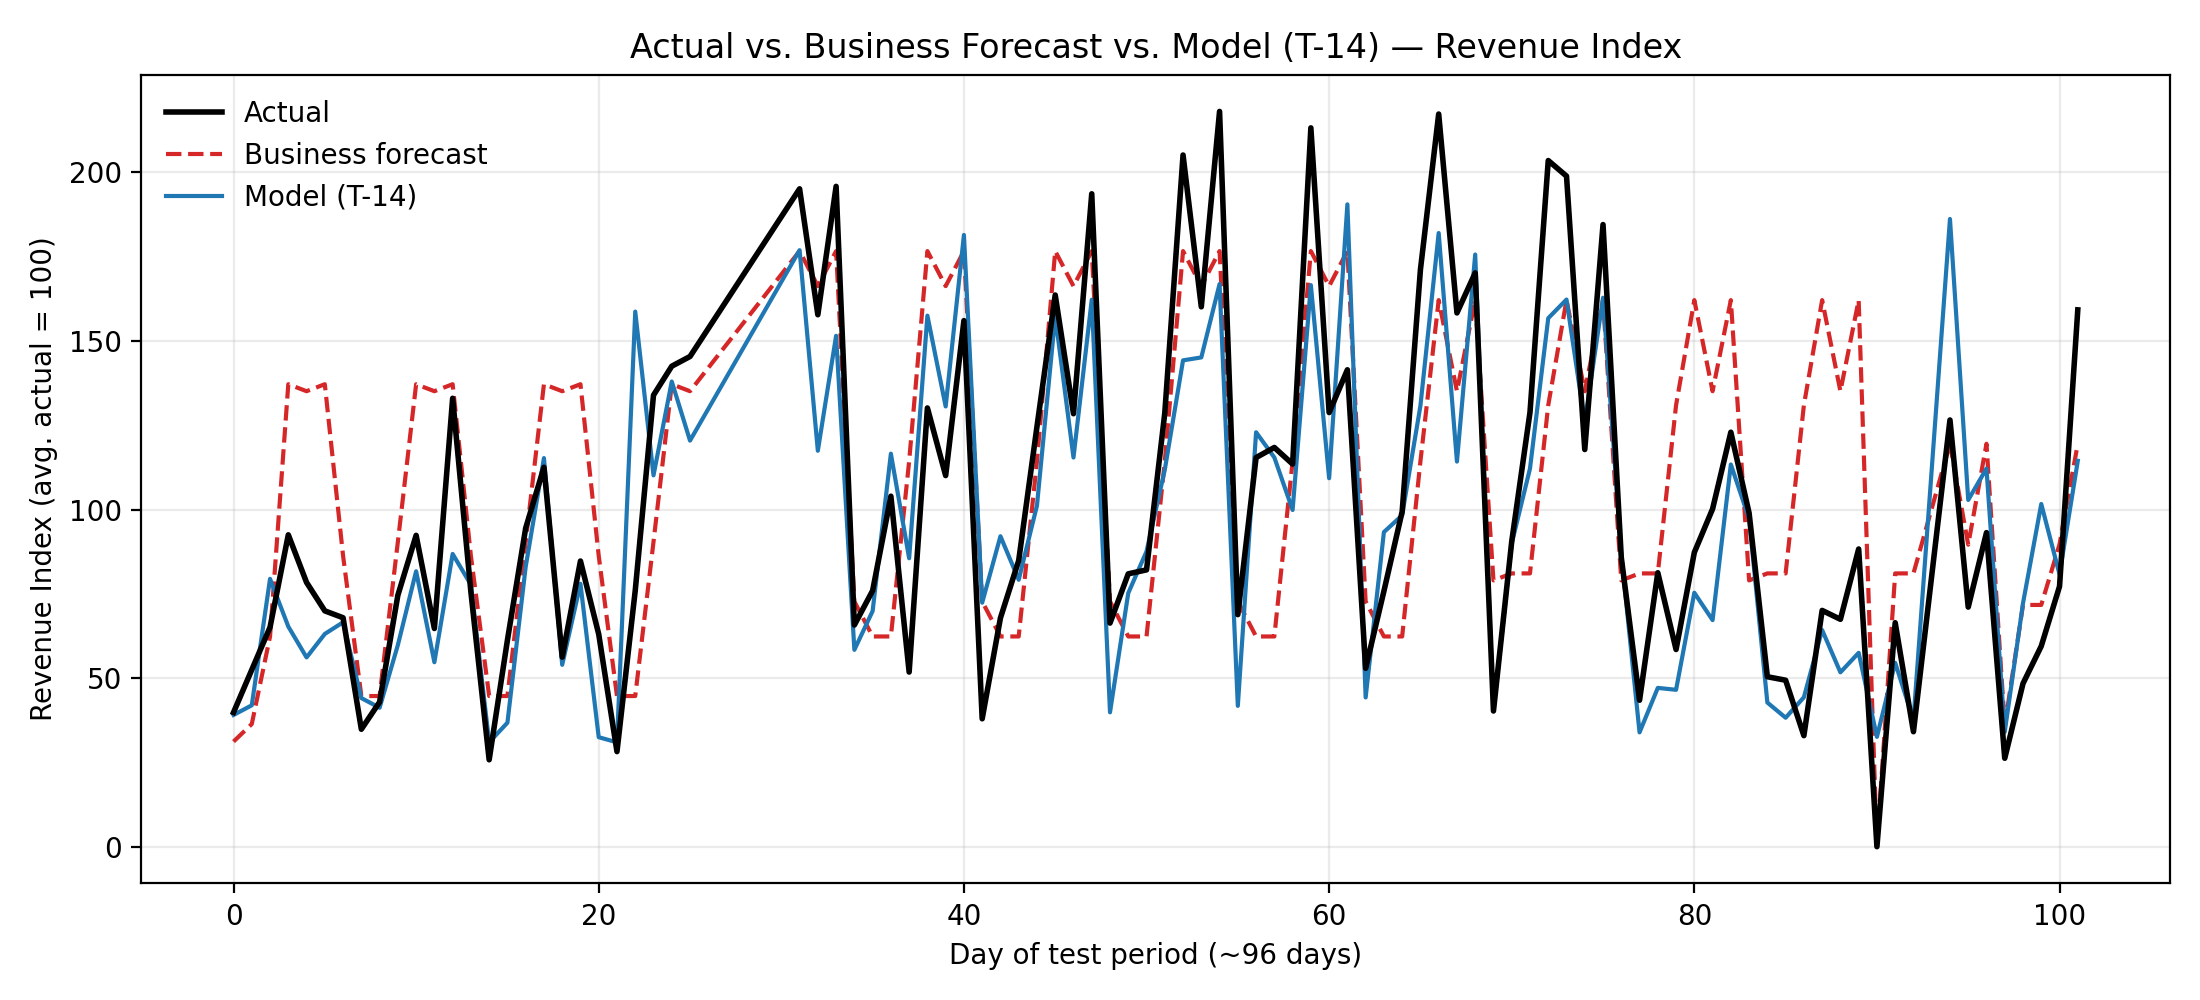
Actual net revenue vs. the business’s own forecast vs. the model (T-14), test period. Revenue Index: average actual revenue over the period = 100.
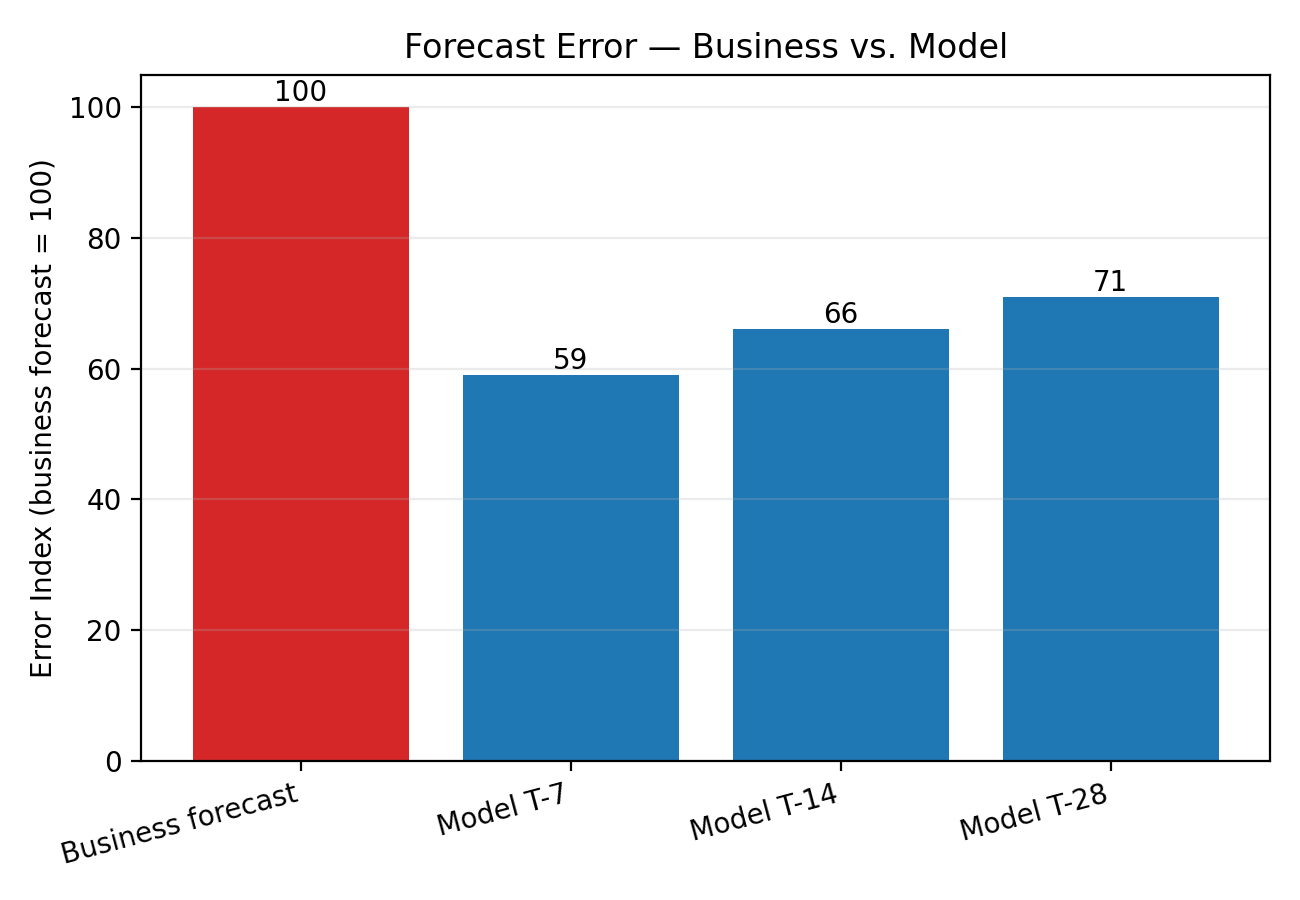
| Error Index | vs. business forecast | |
|---|---|---|
| Business forecast | 100 | — |
| Model, T-7 | 59 | 41% lower error |
| Model, T-14 | 66 | 34% lower error |
| Model, T-28 | 71 | 29% lower error |
Error Index: the mean absolute error in revenue projections; if the mean absolute error of the business forecast is £100, then the T-7 model is £59 (lower is better; this is more intuitive when using real currency figures).
The model outperformed the business’s own forecast at every horizon tested, by a wide enough margin that it’s unlikely to be noise. It suggests that the quantitative signals available (tickets already sold, reservations already on the books, day of week) capture a meaningful share of what drives demand in a way that’s systematic and repeatable, as opposed to any one person’s read of the calendar.
Limitations
- Only ~15 months of history. This is long enough to validate the approach, but likely too short to fully capture seasonal patterns or rare high-impact events (a single unusually successful or unsuccessful show can carry disproportionate weight in a dataset this size).
- Residual autocorrelation. Diagnostic testing (Durbin-Watson, consistently in the 1.1–1.5 range rather than the ~2.0 that would indicate no leftover pattern) suggests the model isn’t fully capturing something structured. There are a number of things that this could be explained by, such as show-run effect where a production running for weeks changes the baseline demand for its whole run, or a few types of events that aren’t captured in the data.
- No weather data. There is a large, weather-dependent terrace (closed in poor conditions/off season, and a real draw during good weather). This is a plausible real driver of variance this model doesn’t yet account for.
- Cold-start problem for unseen shows. The model has no way to flag “this specific show is unusually popular” beyond what its ticket sales pace already implies. This is a reasonable limitation, but one worth naming explicitly.
- Some event types aren’t integrated into the model. The events filter doesn’t capture occasional but high-impact events that drive real business: third-party talks, graduations, and film/TV premieres. Days driven by these are effectively invisible to the model, and are the most likely source of its largest individual misses.
Future Considerations
If the venue and restaurant wanted to take this from proof of concept to an operational tool:
- Split ticket features by event type (theatre vs. concert, at minimum) rather than pooling all “live” ticket sales into one number. The two audiences behave differently, and pooling them may be washing out signal the model could otherwise use.
- Audience demographic data, if available, at the show level could help explain why two shows with similar ticket counts drive very different covers or revenue, rather than just observing that they do.
- Prediction intervals, not just point estimates. A manager deciding how many staff to schedule needs a plausible range, not just a single number.
- Weather integration, likely only meaningfully useful at T-1/T-2, possibly T-3 given how quickly weather forecasting accuracy degrades further out.
- Smaller candidate signals. These I expect to matter less individually but still may be worth exploring: ticket sales for other things happening in the building (ie. cinema, galleries, exhibitions, temporary experiences), and the share of tickets sold to venue members specifically. In the same vein, consider adding in the aforementioned third-party events, graduations, and large events (i.e. film/TV premieres). You could also split concert ticketing data by resident vs. visiting performers, since a resident ensemble often has a dedicated following who tends to come to the restaurant.
- Build the email report: an automated daily or weekly email to the restaurant manager with a rolling covers/revenue forecast (with ranges) and week-over-week change, as a simple table and chart. This step would operationalize the model, turning this analysis into a tool the team can rely on week to week.
Conclusion
A relatively simple, interpretable model that predicts a pre-theatre restaurant’s daily covers and net revenue meaningfully well up to four weeks in advance. It’s more accurate than existing forecasting, and doesn’t use any data that isn’t already available. It isn’t a finished product, and several concrete next steps would meaningfully improve it further. But as a proof of concept, the core question has a clear answer: yes, this demand is systematically predictable from data already on hand, and a model built to do so already outperforms the status quo.
Feel free to download the full report here:

